Solana has cemented itself as part of crypto’s Big Three. And with the others having or on the cusp of a spot ETF, not only is it likely just a matter of time before Solana gets one too, but also the impact on SOL just might be the largest yet.
Note: GSR is long SOL.
Solana – Synchronizing the World at the Speed of Light
Founded in 2018 by Anatoly Yakovenko and Raj Gokal and launched in 2020, Solana is a delegated proof-of-stake blockchain built for performance and mass adoption. With ultra-cheap transaction costs, a wide array of decentralized applications, and bustling user and developer communities, it’s no wonder that Solana has amassed nearly 300 billion transactions and over $4 billion in total value locked. Moreover, Solana continues to distance itself from the pack, with recent highlights including a plethora of high-profile token launches, various project migrations to Solana, the release of key innovations like token extensions, and a flurry of activity around use cases only possible on Solana, including order books, bulk NFTs, DePINs, memecoins, and more.
Underlying Solana’s success is its superior technology, which, in our opinion, provides a sustainable competitive advantage and is exemplified by three particularly notable items. First is Solana’s proof-of-history, which imbues validators with a notion of time. Similar to cell towers alternating transmission to avoid noise, proof-of-history enables validators to produce blocks when it’s their turn without requiring the network to first agree upon the current block, resulting in massive speed and scalability advantages. Second, unlike the single-threaded virtual machines behind much of the current crypto landscape, Solana enables parallel transaction processing to not only materially increase throughput, but also take advantage of the main source of improvement in computing speeds, with most gains today coming from adding more cores rather than improving the performance of each one. Lastly, while Solana’s historically high hardware and bandwidth requirements optimize for speed and security at the expense of decentralization, Solana is naturally positioned to benefit as costs fall over time, known as Moore’s Law, to be perhaps be the first to truly solve the blockchain trilemma and ultimately achieve its vision of synchronizing global state at the speed of light.
Recent Solana Highlights and SOL Price
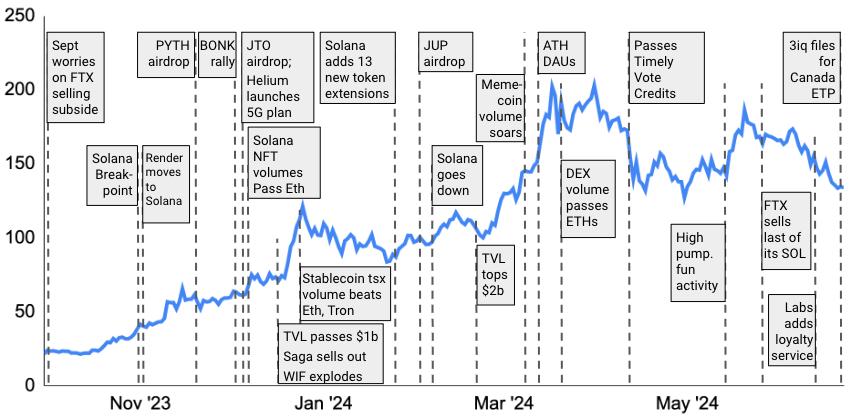
Source: Santiment, GSR.
The Rising, Underappreciated Odds of Additional Crypto ETFs
With Solana cementing itself alongside Bitcoin and Ethereum as crypto’s “Big Three” and Bitcoin and Ethereum both (or on the cusp of) having US spot ETFs, it naturally begs the question – will Solana be next? And, this is a particularly pertinent question to answer with the spot ETFs the main driver of price in the current cycle.
The simple answer is that under the current construct, the route to bringing a spot digital asset ETF to fruition in the US is clear, requiring a federally-regulated futures market (of which there are none beyond Bitcoin and Ethereum), the futures market to exist for multiple years to demonstrate sufficient correlation, and a futures-based ETF to be approved before one can begin to consider a spot product. In other words, there will be no additional spot digital asset ETFs anytime soon. However, we believe this vastly underestimates the potential for change.
In fact, change is already afoot with Donald Trump’s newfound backing of the crypto industry, which has in turn caused Democrats to loosen their stance against digital assets in a tight election year. Indeed, while unthinkable just a month ago, we have already seen the bipartisan passage of a measure overturning a controversial SEC crypto accounting policy (SAB 121) in both sides of Congress, as well as the passage of a comprehensive digital asset regulatory framework (FIT21) in the House. And while the current legislative and regulatory makeup is unlikely to adopt rules enabling the launch of myriad spot digital asset ETFs, a Trump administration and liberal SEC Commissioner could do exactly that, with the possibilities truly opening up with a securities and commodities-defining digital asset market structure bill. Not only is such a scenario possible, but it may even be probable.
Key Determinants for the Next Spot ETF
With more permissive laws and regulations, we believe the two key items determining the next spot digital asset ETF are the level of decentralization and potential demand. On the former, whether from FIT21’s sidestepping of the Howey Test by creating new digital asset categories with a key decentralization test, or from the SEC’s own suggestion that being “sufficiently decentralized” could impact securities classification, the level of decentralization could be key as to whether a digital asset may get an ETF. On the latter, potential demand for any new ETFs will be just as important, as it will be the largest factor impacting profitability. Here, issuers will likely weigh potential demand with additional considerations such as reputational risk, the ability to pass various internal committees, and client best interest. All in, while crypto-native issuers may file for a good number of spot digital asset ETFs, we believe larger issuers are more likely to focus on just one or two with both sufficient decentralization and high potential demand determining which digital assets are next.
In what follows, we provide brief analyses attempting to quantitatively determine both a Decentralization Score and a Demand Score before adding them to form an ETF Possibility score. Note that we convert the various category metrics into Z-scores to enable combining categories, before taking a simple average of each category’s Z-score to compute the final Decentralization and Demand Scores. Finally, note that many metrics used have flaws and some level of subjectivity, though we believe are still informative for the task at hand. So without further ado…
Decentralization Analysis
Analyzing a blockchain’s level of decentralization is difficult as there is no generally agreed upon definition, many metrics leave something to be desired, and the topic in general is highly nuanced, technical, and even philosophical. Moreover, decentralization incorporates a whole host of ideas like permissionless participation, developmental control, key figure influence, token allocation/distribution, stake characteristics, and software and hardware diversity to name a few. Finally, note that most public blockchains progressively become more decentralized over time, and such is the case with the group below, exemplified by Cardano’s upcoming Voltaire era that will materially decentralize governance or by Solana’s forthcoming introduction of the Firedancer client that will make Solana the only network other than Bitcoin and Ethereum with a second independent client live on mainnet. With all that said, we believe some of the more robust and informative decentralization metrics are:
- Nakamoto Coefficient, which measures the smallest number of independent entities that may collude to attack a network, with a higher number indicating greater decentralization
- Staking Requirements, which measures the ease in which anyone may partake in the network as a node operator or validator, encompassing both minimum stake and hardware requirements, and with less stake and lighter hardware supportive of greater decentralization
- CCData Governance Rating, which incorporates various governance measures around participation, transparency, and decentralization
As shown below, the four blockchains with above average decentralization scores are Ethereum, Solana, Avalanche, and Aptos.
Decentralization Scores
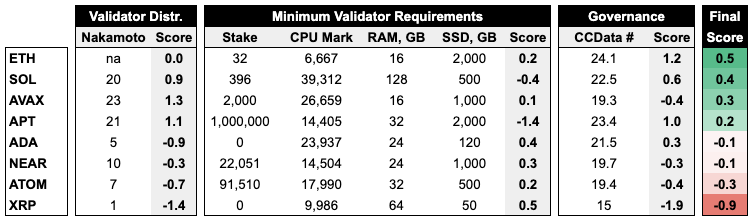
Source: Nakaflow.io, Messari, CCData, GSR. Notes: We override Nakaflow’s Nakamoto Coefficient for Ethereum of 1 given the significant debate around whether to look through Lido to its underlying operators and thus simply assign Ethereum an average score on this metric. Nakaflow does not provide a Nakamoto Coefficient for Cardano, and we use 5 as Input Output Hong Kong controls 5 of 7 genesis keys which give it control over the network. In addition, Nakaflow does not provide a Nakamoto Coefficient for XRP, which comes from here, while Messari does not include XRP validator requirements in its data, which we get from here. Finally, note that the SEC has alleged that many of the above assets are securities in various actions, including ADA, SOL, NEAR, ATOM, and XRP.
Demand Analysis
Potential demand is another key determinant, where issuers are likely to look at various metrics when assessing future inflows. Chief among these is token market cap, but more generally, we see three categories that are particularly informative:
- Market Indicators, where a higher market cap with higher trading volumes and strong token performance is likely indicative of strong future demand
- Existing Product AUM, where high global AUM in existing investment products for a token portends well for what demand of a spot ETF product may look like
- Activity Metrics, where a strong, active community and widespread use is also likely telling of future demand
As shown below, the three blockchains with above average demand scores are Ethereum, Solana, and NEAR.
Demand Scores
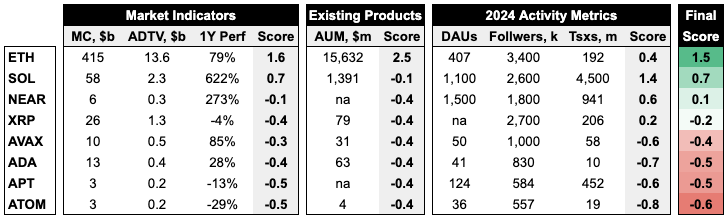
Source: CoinGecko, CoinShares, Artemis.xyz, Twitter, GSR. Notes: Global AUM for NEAR and APT is not available and assumed to be zero.
Adding together our Decentralization and Demand Scores gives us a final ETF Possibility Score. Note that we weight decentralization 33% and demand 67%, as we believe decentralization may be more of a gating factor, while potential demand will likely be the main criteria used by issuers. Overall, Ethereum, which had pivotal spot ETH ETF 19b-4 filings approved in May and is expected to see multiple spot ETFs launched this summer, came in first place by a wide margin. Next is Solana, which also outpaced the next closest digital asset by a large margin and was the only other besides Ethereum to have positive scores for both decentralization and demand. Rounding out third place is NEAR due to decent performance across both categories. All in, the results clearly suggest that Solana is next, should additional spot digital asset ETFs be permitted in the US.
ETF Possibility Score
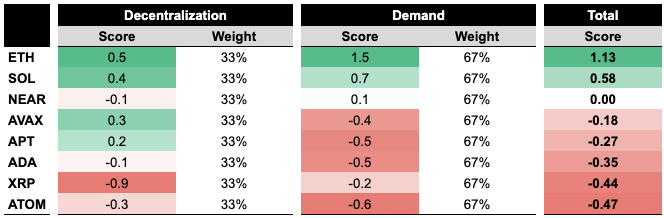
Source: GSR.
The Impact on Price of a Potential Spot Solana ETF
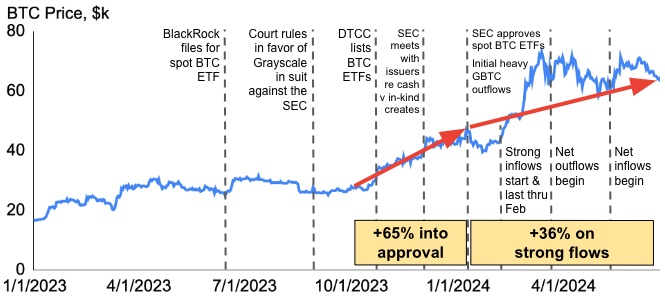
To assess the impact of a potential spot Solana ETF on the price of SOL, we can simply turn to the impact the spot Bitcoin ETFs had on Bitcoin. After all, the approval of the spot Bitcoin ETFs and subsequent exceptional inflows has been the overwhelming factor moving Bitcoin from $27,000 in October when market participants began to ascribe a real possibility of a spot ETF approval in the US to ~$63,000 now, for a 2.3x increase. This 2.3x will be our baseline.
Bitcoin’s Price More than Doubled due Mainly to the ETF
Source: Santiment, GSR.
Next, we need to adjust our analysis for what will be clearly smaller inflows into a spot Solana ETF relative to that of Bitcoin by ultimately estimating inflows a spot Solana ETF would take in relative to that of Bitcoin. Here, we look at three simple scenarios.
- Bear: Solana global investment product AUM amounts to 2% of that of Bitcoin. We believe this underestimates potential Solana ETF inflows, as this measure gives Bitcoin a large head start with the Grayscale Bitcoin Trust having launched in 2013 but Solana not even launching itself until 2020. As such, we use 2% as our bear case inflows.
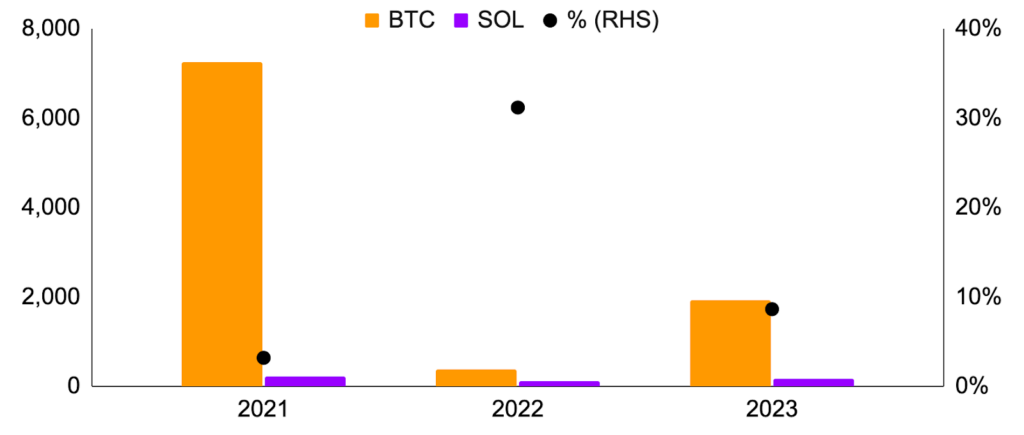
- Base Case: We turn to actual recent inflows to assess how Solana may do. Here, we use 2021 through 2023 inflows, as Solana was not well-known prior to 2021 and stop prior to 2024 to exclude the impact of the spot Bitcoin ETFs, which launched in January. Over the three years, Solana investment products took in 5% of the cumulative inflows relative to Bitcoin inflows. We view this 5% as our baseline scenario.
- Blue Sky: Solana’s relative inflows have been much higher in the last two years, representing 31% and 9% of Bitcoin inflows in 2022 and 2023, respectively. While we would not expect Solana to fully keep pace with periods of exceptional Bitcoin inflows such as in 2021 and 2024, we view the 14% average annual relative inflow over the three years as the potential blue sky scenario.
BTC and SOL: Global Investment Product Inflows, $m, 2021-2023
Source: CoinShares, CoinGecko, GSR.
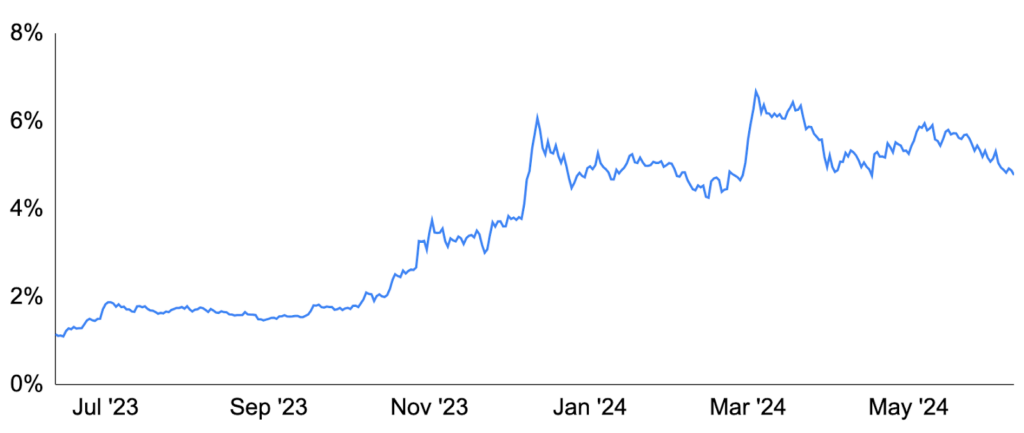
While a spot Solana ETF could see inflows as a percentage of Bitcoin’s of 2%, 5%, or 14% under a bear, baseline, and blue sky scenario, respectively, we must now adjust the impact a spot ETF may have on SOL for its smaller size, which we do using market cap. Specifically, Solana’s market cap has averaged just 4% of Bitcoin’s over the last year.
Solana Market Cap as a Percentage of Bitcoin Market Cap, LTM
Source: Santiment, GSR.
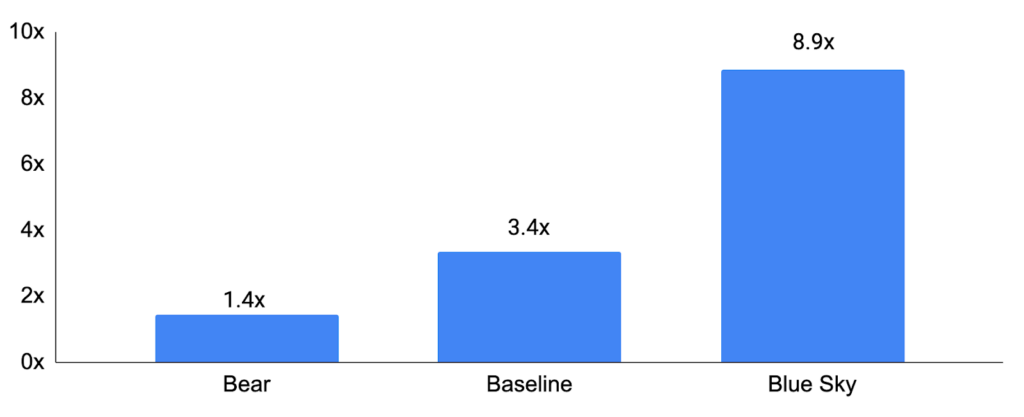
Putting it all together, we can adjust our relative flow estimates under the various scenarios for Solana’s relative size to Bitcoin’s 2.3x increase due to the spot ETFs. Doing so suggests Solana may increase 1.4x under the bear flows scenario, 3.4x under the baseline scenario, and 8.9x under the blue sky scenario. Moreover, there are reasons to believe the impact could be higher than these estimates, since unlike BTC, SOL is actively used for staking and within decentralized applications and as the relationship between relative flows and relative size may not be linear. Lastly, note that there is likely much less in the price of SOL for a potential spot Solana ETF than there was for Bitcoin at the start of our analysis as inferred by the Grayscale Trust deviations from NAV1. If true, SOL’s exceptional potential upside with a spot ETF could be thought of as a “free option”, all else equal. All in, Solana is poised for a spot ETF if and when additional spot digital asset ETFs are allowed in the US, and the impact on price may just be the largest yet.
SOL Price Impact Under Various Inflow Scenarios
Source: GSR.
1The price of the Grayscale trusts may deviate from its underlying NAV given the lack of a real-time creation and redemption mechanism, but any discount or premium should collapse as the trust is converted to a spot ETF, which enables such a mechanism. The Grayscale Bitcoin Trust (GBTC) traded at a 45% discount to NAV on January 1, 2023 (prior to BlackRock filing for its spot Bitcoin ETF on June 15 and Grayscale winning its court case against the SEC on August 31) but this reduced to a 21% discount by the start of October, indicating that the price of Bitcoin likely had something in it for the increased chance of a spot Bitcoin ETF at the start of our price impact measurement.
This material is provided by GSR (the “Firm”) solely for informational purposes, is intended only for sophisticated, institutional investors and does not constitute an offer or commitment, a solicitation of an offer or commitment, or any advice or recommendation, to enter into or conclude any transaction (whether on the terms shown or otherwise), or to provide investment services in any state or country where such an offer or solicitation or provision would be illegal. The Firm is not and does not act as an advisor or fiduciary in providing this material. GSR is not authorised or regulated in the UK by the Financial Conduct Authority. The protections provided by the UK regulatory system will not be available to you. Specifically, information provided herein is intended for institutional persons only and is not suitable for retail persons in the United Kingdom, and no solicitation or recommendation is being made to you in regards to any products or services. This material is not a research report, and not subject to any of the independence and disclosure standards applicable to research reports prepared pursuant to FINRA or CFTC research rules. This material is not independent of the Firm’s proprietary interests, which may conflict with the interests of any counterparty of the Firm. The Firm trades instruments discussed in this material for its own account, may trade contrary to the views expressed in this material and may have positions in other related instruments.Information contained herein is based on sources considered to be reliable, but is not guaranteed to be accurate or complete. Any opinions or estimates expressed herein reflect a judgment made by the author(s) as of the date of publication, and are subject to change without notice. Trading and investing in digital assets involves significant risks including price volatility and illiquidity and may not be suitable for all investors. The Firm is not liable whatsoever for any direct or consequential loss arising from the use of this material. Copyright of this material belongs to GSR. Neither this material nor any copy thereof may be taken, reproduced or redistributed, directly or indirectly, without prior written permission of GSR.
